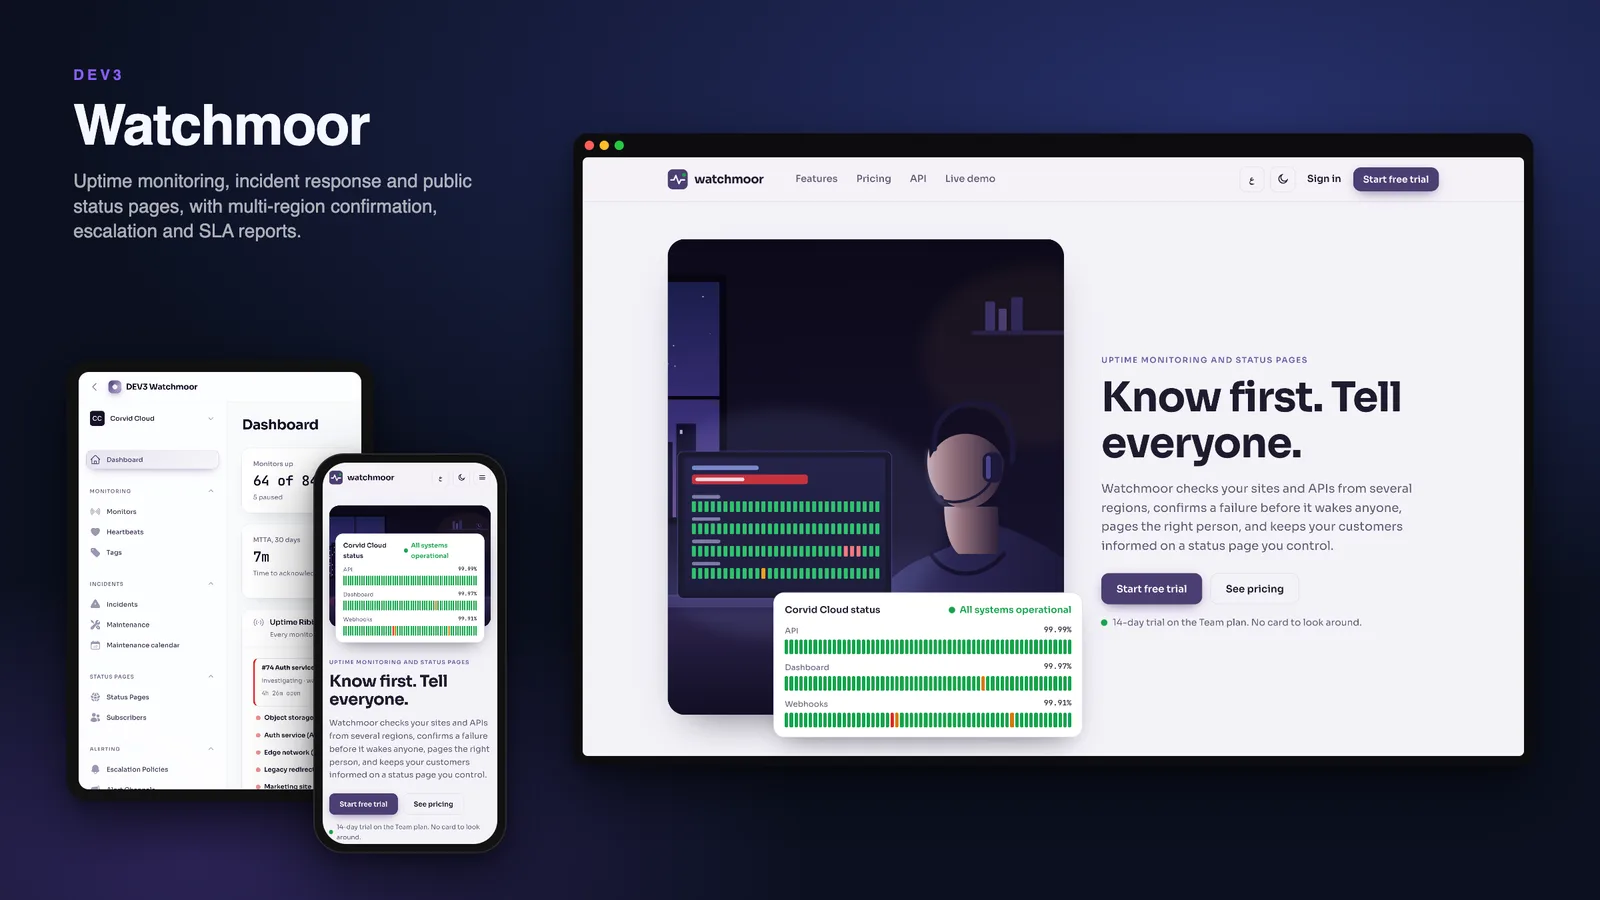
DEV3 Technologies home

DEV3 Watchmoor – Uptime Monitoring & Status Page SaaS Laravel Script with Incidents, Escalation & SLA Reports

A multi-tenant uptime monitoring SaaS on Laravel 12 and Filament 4: seven check types, multi-region confirmation, incidents with escalation, branded status pages with subscribers, maintenance windows, SLA reports and an API. Web installer and demo data included. No mobile apps.
by DEV3 TechnologiesVerified Author(0) 0 sales 1 viewsUpdated 08 Nov 2026

Launch Offer: up to 50% off

This item is 50% off: $24.50 instead of $49

Ends in
--
Days
--
Hrs
--
Min
--
Sec

Video tour. Pick a section below to browse 105 screenshots in 10 sections.

App & phone tours

Tap play to watch each app. Nothing downloads until you do.

  • Mobile web1:06

Watchmoor is an uptime monitoring and status page platform that you run as a multi-tenant SaaS, built by DEV3 Technologies on Laravel 12 and Filament 4. Workspaces watch their sites and APIs, confirm a failure before anyone is paged, run incidents with escalation, and publish branded status pages. You sell plans, and every workspace is isolated from the others.

What it does

  • Seven kinds of check. HTTP with redirects and a slow limit, keyword, JSON path, TCP port, TCP ping, SSL expiry and heartbeat URLs for cron jobs. A new monitor runs its first check straight from the wizard.
  • Confirmation across regions. A failure counts only when the configured number of regions agree (n of m, default 2 of 3). Flap damping groups noisy monitors into one summary.
  • Incidents and escalation. Confirmed failures open an incident, group monitors that fail within two minutes, page the first step of an escalation policy and move on if nobody acknowledges. Manual incidents, updates, postmortems and auto-resolve are included.
  • Public status pages. Three layouts, logo and accent colour, light and dark, Arabic right to left, 90-day uptime bars, maintenance notices, an Atom feed, password or IP-restricted pages, and subscribers with double opt-in and component filters. Pages are server-rendered and cached for 30 seconds.
  • Maintenance windows. A calendar of planned work that pauses alerts for chosen monitors and is left out of the uptime maths.
  • The Uptime Ribbon. One row per monitor and one bar per day for 90 days on the dashboard, with open incidents pinned above.
  • SLA reports. Monthly and daily uptime, downtime minutes, MTTA, MTTR and response percentiles per monitor, as PDF and CSV.
  • Alert channels. Email, SMS, signed webhook and chat webhook, with a verification step and a delivery log with retries.
  • SaaS layer. Plans with limits (monitors, interval, regions, status pages, subscribers, SMS, API), trials, billing page, team roles (owner, admin, responder, viewer), an operator panel with workspaces, probe nodes, queue health, target blocklist, abuse reports, audit log and audited view-only impersonation.
  • API (plans with API access): scoped keys hashed at rest, rate limits with headers, one error envelope and an OpenAPI document.
  • Safe by design. Every outbound check goes through an SSRF-safe client that resolves the host once, pins the address, re-checks every redirect and refuses private, loopback, link-local and metadata addresses.

Install and demo data

A web installer checks the server, writes the configuration, migrates and loads either demo data or an empty install, then creates the operator account. The demo has 10 fictional workspaces, 420 monitors, thirteen months of uptime history, incidents with postmortems, maintenance windows, 18 status pages and about 4,500 subscribers. Every demo password is password. Node.js is not needed because compiled assets are included.

Good to know before you buy

  • Probe regions are logical. Out of the box checks run from the server where you install it. The eu-west, us-east and ap-south regions are simulated from that same result with seeded latency offsets. To check from real places you run the small probe agent (php artisan watchmoor:agent) on servers elsewhere with a node token.
  • "Ping" is a TCP connect, not ICMP. PHP cannot send ICMP without root, so the check is labelled TCP ping in the interface.
  • Email and SMS alerts are simulated. They are written to a message log until you add a mail transport and an SMS provider driver. There are no voice calls.
  • Webhook and chat-webhook channels are real, and go through the same SSRF-safe client as the checks.
  • Custom domains need your TLS. Watchmoor verifies the DNS records of a status page domain but does not issue certificates; terminate TLS on your own proxy.
  • Demo monitors target fictional *.example hosts that a simulated driver answers; they never leave the server. Real targets are checked for real.
  • A cron entry is required. schedule:run every minute drives the checks. A queue worker is recommended; QUEUE_CONNECTION=sync works for small installs and is bounded per run.
  • Subscriptions use a simulated billing gateway until you configure one. You are the merchant of record for your customers.
  • Web only. There are no mobile apps.
  • No hosted demo. The brands, people and places in the screenshots are fictional.

Quality checks

Watchmoor 1.0.0 passed the seven release gates of the DEV3 Laravel suite on the final code: static analysis (Larastan level 6), the Pest suite (412 tests), a front-end size budget, migrations and seeding on MySQL 8 and SQLite, a headless-browser pass with MySQL race checks in eight groups (scheduler claims, confirmation votes, incident grouping, quotas and others), an installer test from the package and a secret scan. A security review of the probe client, the state machine and the scheduler found eleven issues, all fixed before release.

How it's built

Architecture, stack, key decisions and the quality gates DEV3 Watchmoor passed before release.

The engineering behind Watchmoor: an SSRF-safe probe client that pins the resolved address, n-of-m confirmation across regions, a scheduler that claims work without double runs and status pages that survive a traffic spike.

The problem it solves

A monitor must reach arbitrary customer URLs without ever becoming a way into the host's own network, must not page anyone for one flaky network hop, and must keep running, and catch up, when a worker stalls. Public status pages must stay up when the product they report on is down.

Architecture and approach

Watchmoor is a Laravel 12 application with Filament 4 panels for workspaces and the operator, Blade status pages, and a JSON API. It builds on the shared DEV3 core for settings, roles, plans and audit.

A probe client that cannot be pointed inward

Every outbound check resolves the host once, validates every address against refused ranges including mapped IPv6 and metadata names, then connects to that exact address. Each redirect is validated again, the body is capped and the Host header is rebuilt, so a rebinding trick or a redirect to a private address fails closed.

Confirmation by vote

Regions report their results and a state change is decided once per time slot after a lock: n of m regions must agree, flapping monitors are damped and maintenance windows are respected. Incidents group monitors that fail within two minutes.

A scheduler that claims and catches up

Due monitors are claimed with row locks that skip rows other workers hold, each slot is unique, and a stalled install records a gap and catches up instead of firing a burst. A sync queue works for small installs, bounded per run.

Pages that stay up

Status pages are rendered on the server and cached for 30 seconds, with day bars computed from state changes, gaps and maintenance in a few bulk queries, so many readers cost one render.

A tenant guard that fails closed

Every tenant model is scoped by workspace, and a generated test walks the API as another workspace and expects 404.

Quality gates and results

Watchmoor 1.0.0 passed the seven release gates on the final code, including Larastan level 6, 412 Pest tests, a headless-browser pass and MySQL race checks in eight groups. A security review of the probe client, state machine and scheduler found eleven issues, all fixed. The demo seed holds 420 monitors, thirteen months of uptime history and about 4,500 subscribers.

Tech stack

Area Technologies
Application Laravel 12, Filament 4, Blade, REST API
Probing SSRF-safe HTTP client, Pinned DNS resolution, Native socket checks, Remote probe agent
Scheduling Row-lock claims, Unique time slots, Gap catch-up, Queue or sync
Concurrency Row locks, n-of-m vote decisions, MySQL race checks
Quality Pest, Larastan level 6, Headless browser smoke, Installer test

Inside the build

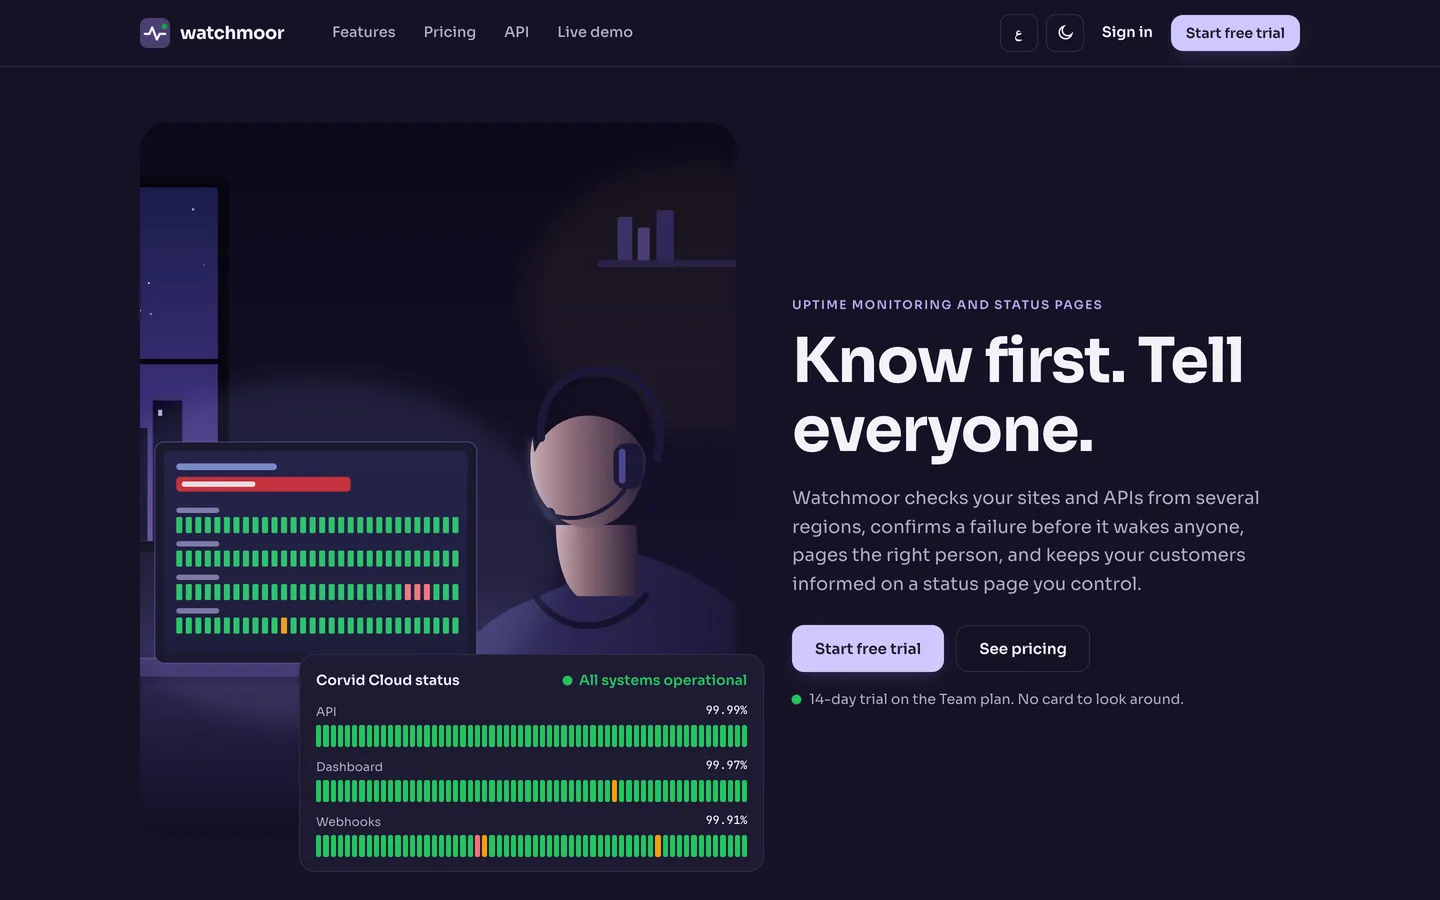
Know first, tell everyone: The home page opens on the night-watch hero with a live status page laid over the photo and one button to start a workspace. Know first, tell everyone — The home page opens on the night-watch hero with a live status page laid over the photo and one button to start a workspace.

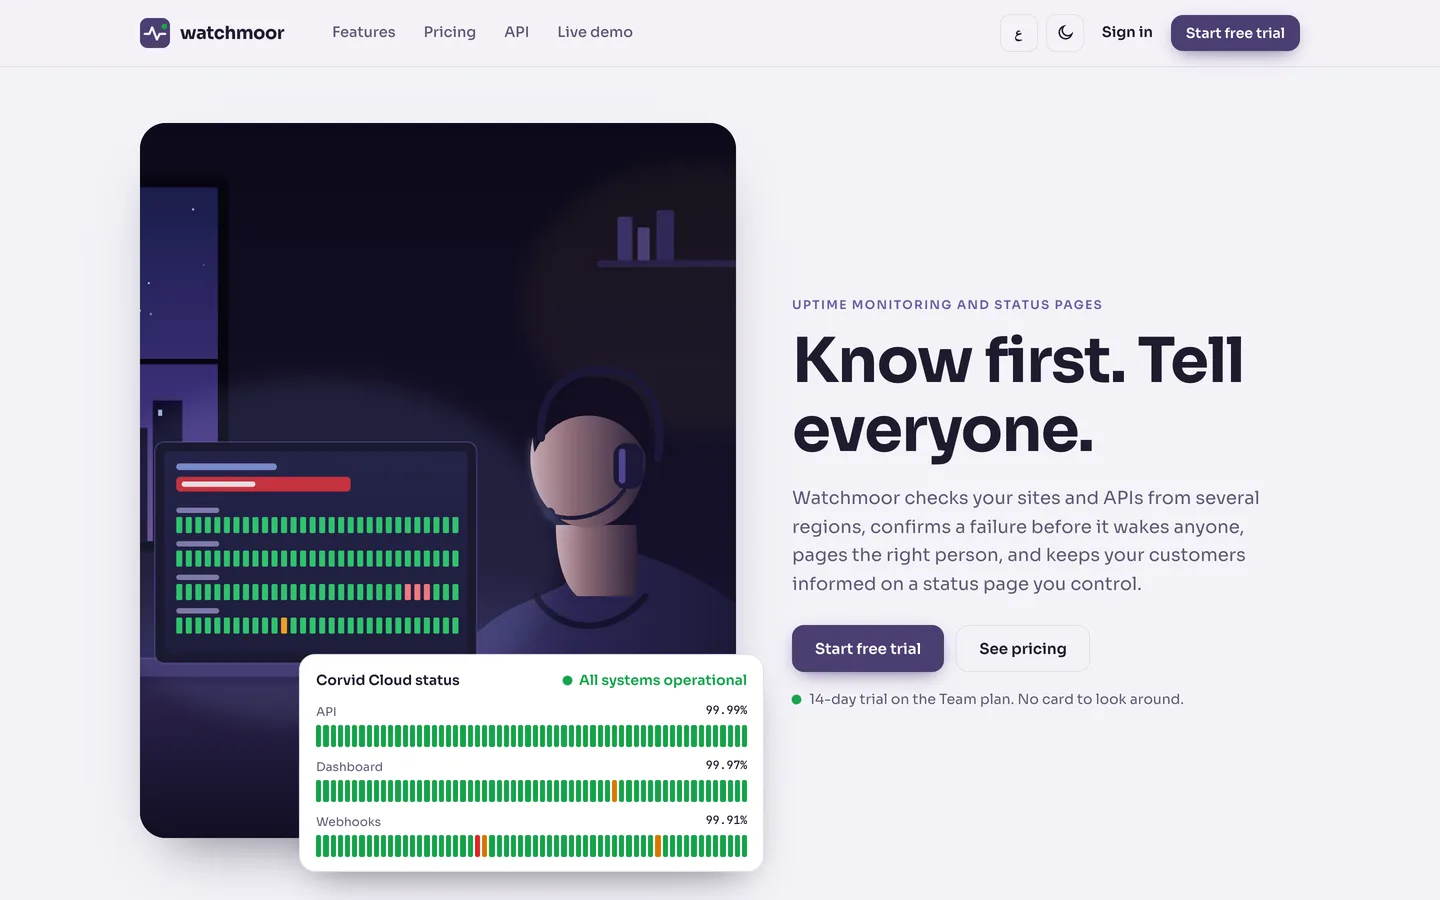
The same page after dark: Heather on near-black with the signal colours kept, so green and red mean the same thing at three in the morning. The same page after dark — Heather on near-black with the signal colours kept, so green and red mean the same thing at three in the morning.

Guides & articles

Practical guides and engineering write-ups for DEV3 Watchmoor.

Uptime monitoring and status pages: 7 things to check before you rely on one

Last updated
Uptime monitoring and status pages: 7 things to check before you rely on one: DEV3 Watchmoor

An outage is the worst time to find out your monitoring is noisy, blind to a region or silent to your customers. Here are seven things to check before you rely on any uptime monitor and status page, with DEV3 Watchmoor as the worked example.
Video tour — a failing monitor becomes an incident, then the public status page and the SLA report

Watchmoor home page: a sample status page with 90-day uptime bars

1. Does one flaky network hop wake you at 3 a.m.?

A single failed request is not an outage. Look for confirmation from more than one region before anyone is paged, and for damping when a monitor flaps. Watchmoor needs n of m regions to agree (default 2 of 3) and groups noisy monitors into one summary.
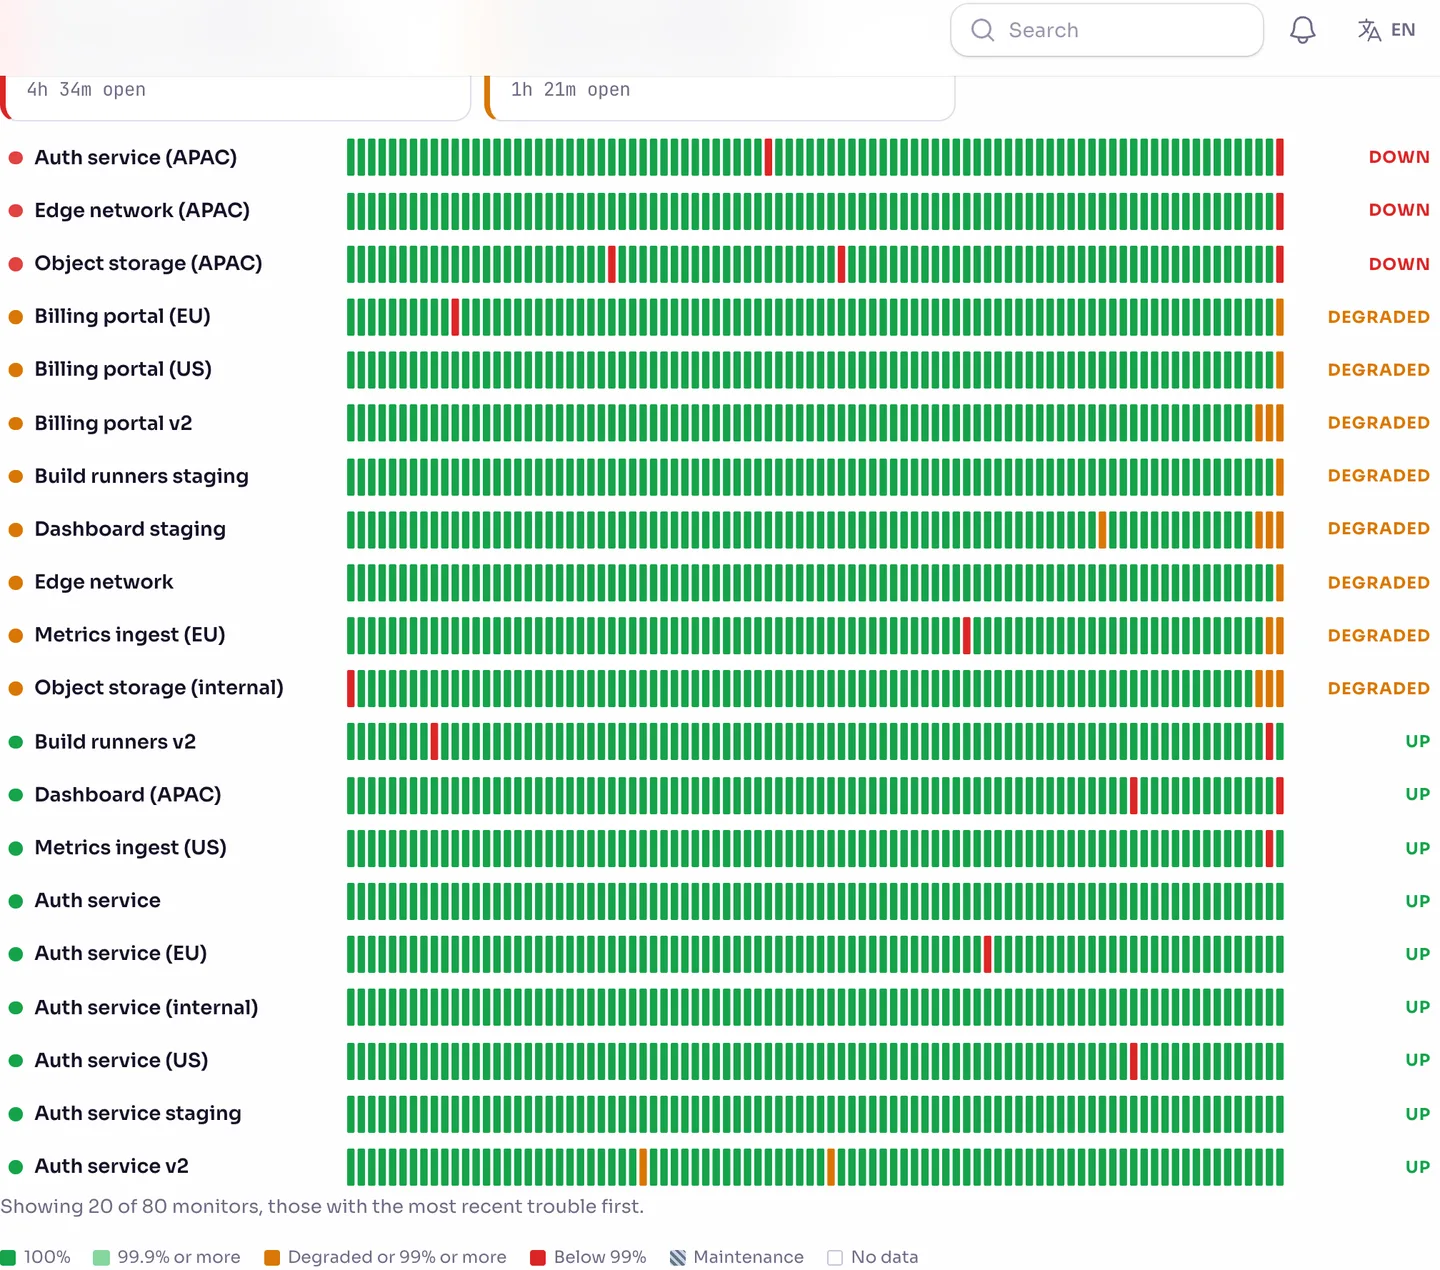
The Uptime Ribbon: one row per monitor, one bar per day for 90 days

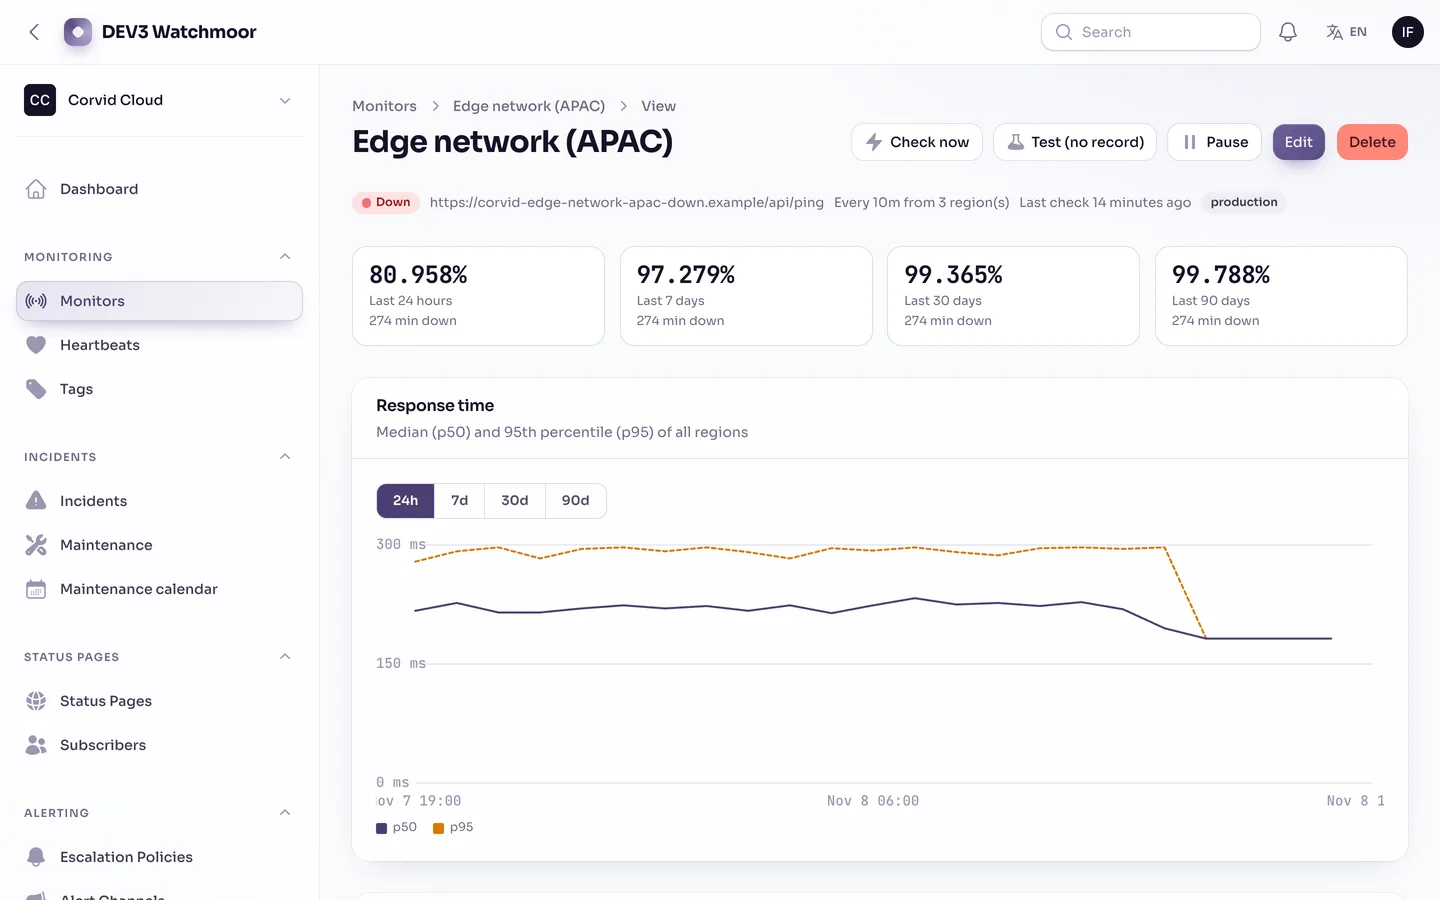
A failing monitor with its state, uptime and recent checks

2. Can it check more than a home page?

Look for keyword, JSON, TCP, SSL expiry and heartbeat checks for cron jobs, not only a status code. The wizard should run the first check straight away.
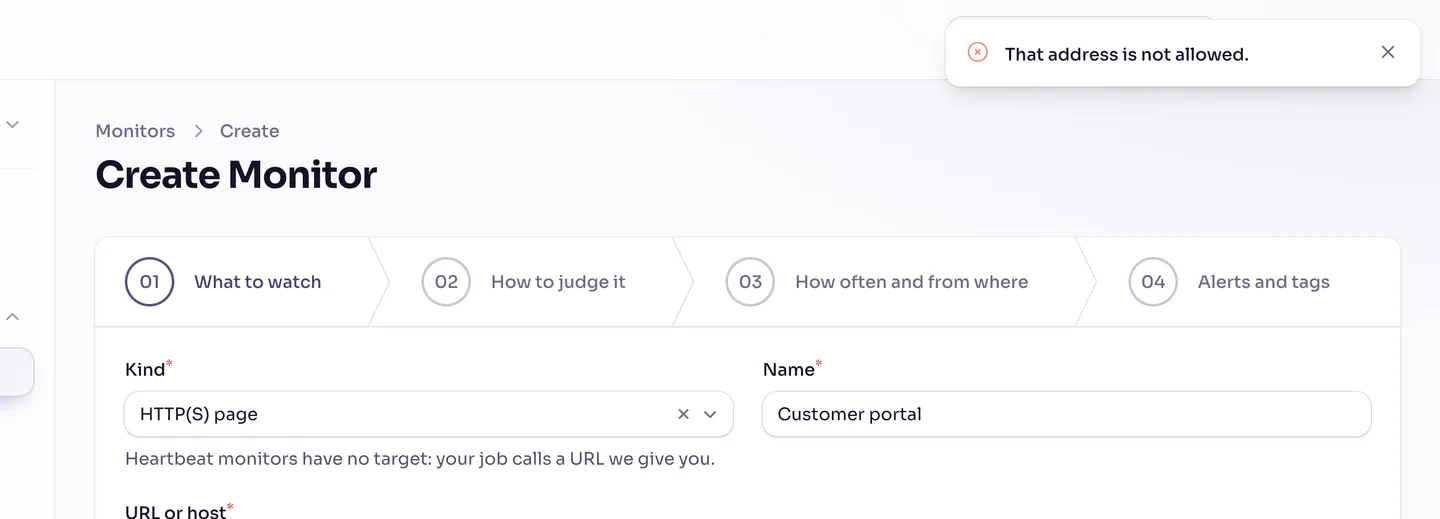
The new-monitor wizard refusing a private address

3. Is the probe itself safe?

A monitor that fetches any URL a customer types can be pointed at your own network. Check that the client resolves the host once, pins that address, re-checks every redirect and refuses private and metadata addresses. Watchmoor does, and an operator blocklist adds more.

4. Does an alert reach someone who acts?

An incident should page the first step of a policy and move on if nobody acknowledges. Look for acknowledge and resolve from a phone, and for a delivery log.
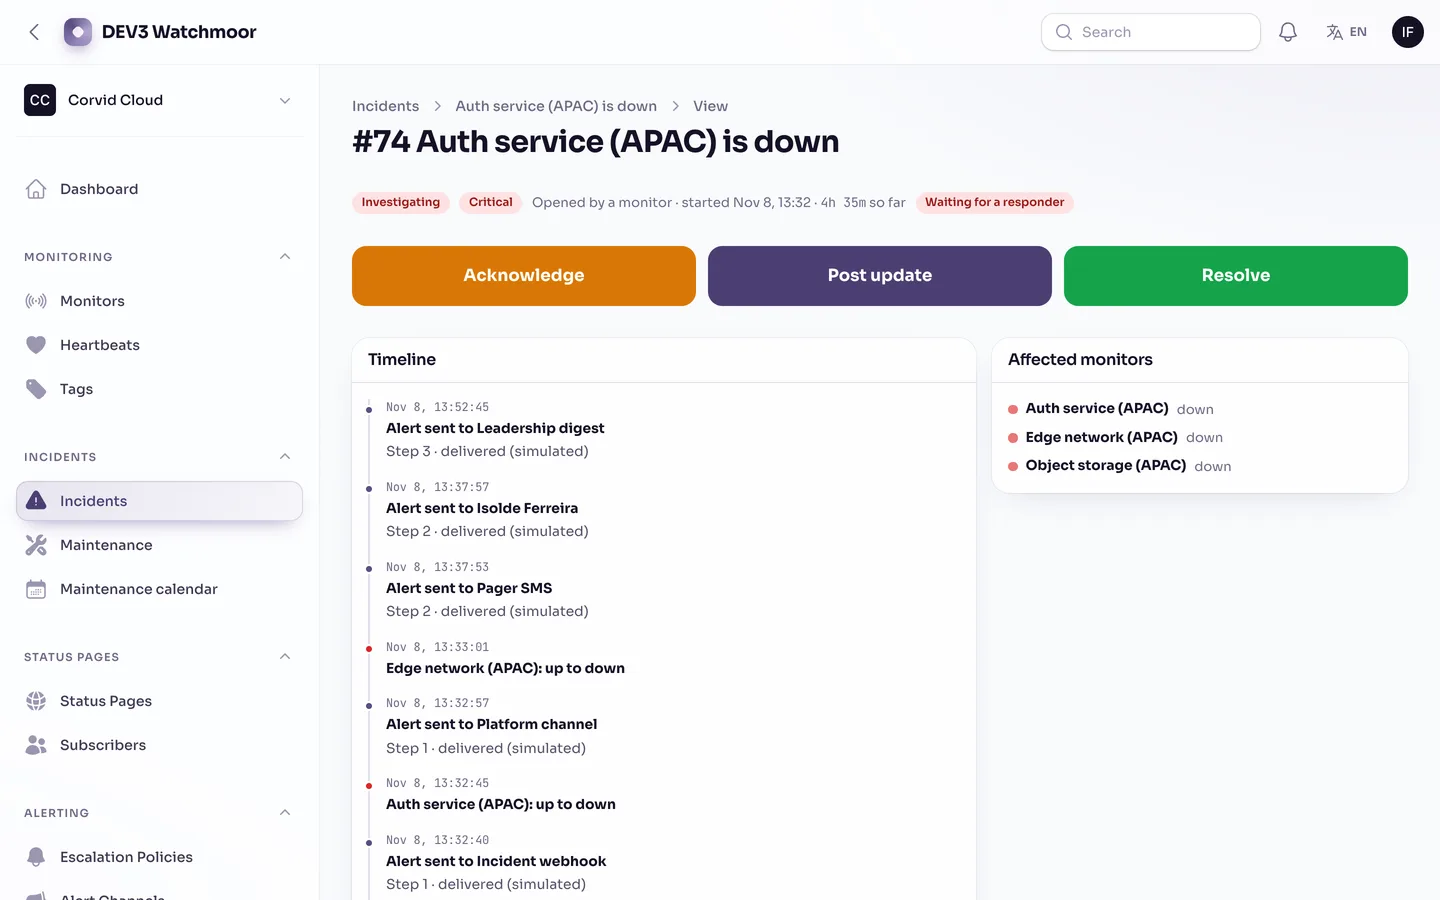
An incident opened by a monitor

Alert channels with their verification dates

5. Can customers see what you see?

A status page should be calm and fast, with uptime bars, subscribers and maintenance notices, and it should not fall over with the product it reports on. Watchmoor renders pages on the server and caches them for 30 seconds.
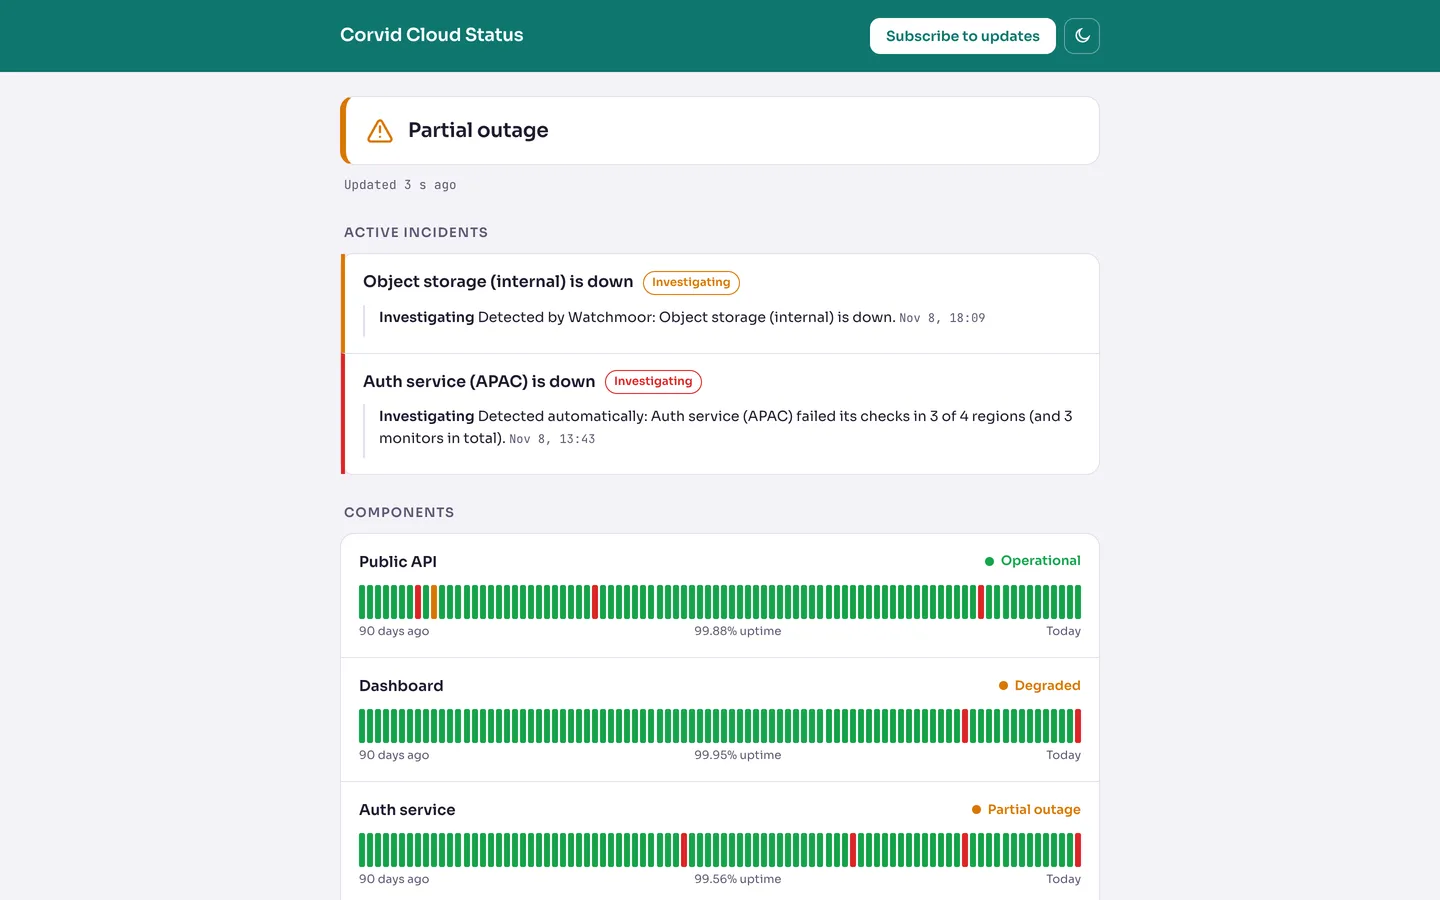
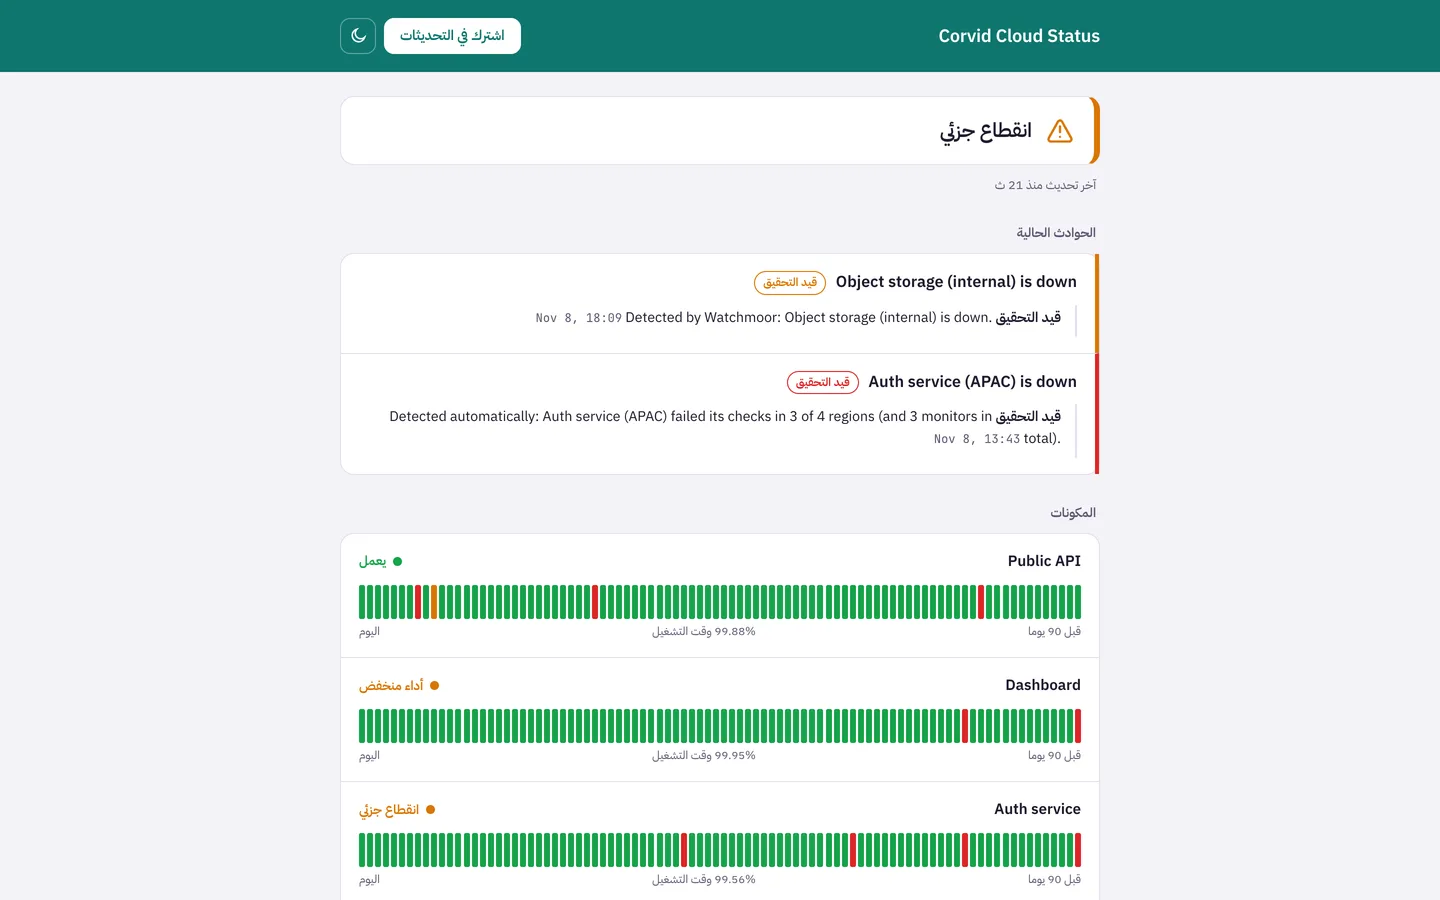
The classic status page layout with 90-day bars

A status page in Arabic, mirrored right to left

6. Is planned work left out of the numbers?

Maintenance windows should pause alerts and be excluded from uptime, and they should show on the page.

The maintenance calendar

7. Can you send a number to a customer?

Look for monthly uptime, downtime minutes, MTTA and MTTR per monitor, exportable.
An SLA report for one monitor and one month

Limits

Regions are logical: checks run from your install, and extra real regions come from running the probe agent on other servers. Ping is a TCP connect, not ICMP. Email and SMS alerts are simulated until you add a mail transport and an SMS provider, and there are no voice calls. Custom domains need your own TLS. Demo monitors target fictional example hosts answered by a simulated driver. A cron entry is required, and billing runs on a simulated gateway. There are no mobile apps.

Frequently asked questions

The complete source code (version 1.0.0) as a download from your account, with the setup and usage guides shown on this page. You can modify the code to suit your product.

Buying guides: Laravel scripts with Filament panels and a web installer · Next.js or Laravel for a SaaS script?

Free snippets from this product

Questions about this product (6)

Answers from the DEV3 team and the community.

Ask a question

More from this author

View all

Related in Web Scripts & Software

View all